Container Logging and Monitoring
Overview
Follow container logs, configure a logging mindset for production, add HEALTHCHECK, and know how metrics reach Prometheus/Grafana.
Stdout/stderr is the default log stream. Drivers ship logs to journald, Fluentd, cloud sinks. Health checks and metrics tell you when to restart or scale.
This is a core tutorial in Module 13 · Logging & Monitoring of the REBASH Academy Docker for Cloud & DevOps Engineers series — written for Cloud, DevOps, Platform, and SRE engineers.
Prerequisites
Learning Objectives
By the end of this tutorial, you will be able to:
- Use
docker logseffectively - Name common logging drivers
- Add Dockerfile/
composehealth checks - Outline cAdvisor / Prometheus scrape path
Architecture
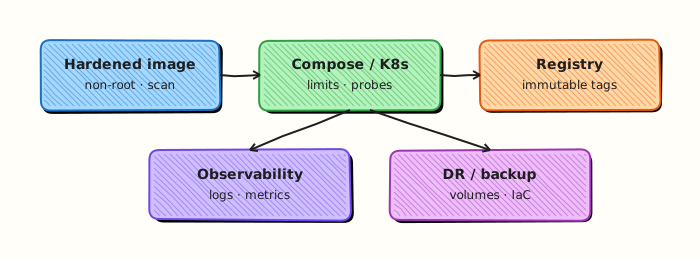
This topic’s control points and relationships are shown below.
Theory
What
Containers emit logs (usually stdout/stderr), expose health signals, and should produce metrics for resources and application golden signals. Docker logging drivers ship container output; healthchecks tell orchestrators whether to restart; metrics come from exporters, cAdvisor-style collectors, or the app’s /metrics endpoint.
Why
When a container exits, logs are often the only explanation. Without healthchecks, load balancers send traffic to dead processes. Without resource metrics, you learn about memory limits from the out-of-memory (OOM) killer. DevOps operability starts at the container boundary.
How it works
Prefer structured JSON logs on stdout; sidecars or agents ship to a central platform. Avoid logging secrets and high-cardinality noise. HEALTHCHECK in Dockerfiles or Compose healthcheck: run a command that exits non-zero when unhealthy. Monitor CPU, memory, restart counts, and application latency/error rate. Locally, docker logs and docker stats are first tools; in production, integrate with the platform’s observability stack.
| Signal | Source |
|---|---|
| Logs | App stdout → logging driver |
| Health | HEALTHCHECK / Compose healthcheck |
| Metrics | cAdvisor, exporters, app /metrics |
Key concepts
- Twelve-factor logging — treat logs as event streams
- Driver choice — json-file defaults vs journald/fluentd in enterprises
- Cardinality — labels/tags that explode metric series
- Correlation — request IDs across services
Define a minimum dashboard per service: restart rate, CPU/memory against limits, error log rate, and latency if applicable. On shared Docker hosts, also watch disk usage for log drivers that default to unbounded json-file growth — set max-size and max-file options. Practice reading logs from a failed container during game days, not for the first time in an outage.
Common pitfalls
- Writing logs only inside the container filesystem
- Healthchecks that always succeed (testing the shell, not the app)
- Logging passwords or tokens
- Alerting solely on container “running” without app metrics
Hands-on Lab
Objective
Deploy a service with a Dockerfile HEALTHCHECK, collect logs with docker logs, capture one-shot metrics with docker stats --no-stream, and prove health status via inspect.
Prerequisites
- Docker Engine or Docker Desktop
curlfor HTTP checks
Lab environment
Workspace: ~/rebash-docker/module-13
Real-world scenario
On-call needs evidence that a container is healthy, emitting structured logs, and within resource expectations. You add a health probe, start the service, capture logs and stats, and file proof for the incident ticket.
Step-by-step tasks
Task 1 – Create image with HEALTHCHECK
Create Dockerfile:
FROM python:3.12-alpine
WORKDIR /app
COPY app.py .
HEALTHCHECK --interval=10s --timeout=3s --retries=3 \
  CMD python -c "import urllib.request; urllib.request.urlopen('http://127.0.0.1:8080/healthz')"
EXPOSE 8080
CMD ["python", "app.py"]
Create app.py:
from http.server import BaseHTTPRequestHandler, HTTPServer
import logging
import sys

logging.basicConfig(stream=sys.stdout, level=logging.INFO, format="%(message)s")
log = logging.getLogger("rebash-log-lab")

class H(BaseHTTPRequestHandler):
    def do_GET(self):
        if self.path == "/healthz":
            log.info("healthcheck_ok service=rebash-log-lab")
            self.send_response(200)
            self.end_headers()
            self.wfile.write(b"ok\n")
            return
        self.send_error(404)
    def log_message(self, *args):
        return

log.info("startup service=rebash-log-lab")
HTTPServer(("0.0.0.0", 8080), H).serve_forever()
Build and run:
cd ~/rebash-docker/module-13
docker build -t rebash-log-lab:1.0.0 .
docker run -d --name rebash-log-18130 -p 18130:8080 rebash-log-lab:1.0.0
sleep 15
curl -sS http://127.0.0.1:18130/healthz | tee curl-healthz.txt
grep -q ok curl-healthz.txt
Expected output
curl-healthz.txt contains ok.
Task 2 – Collect logs and stats evidence
Collect stdout logs and one-shot resource snapshot:
cd ~/rebash-docker/module-13
docker logs rebash-log-18130 2>&1 | tee container-logs.txt
grep -q 'startup service=rebash-log-lab' container-logs.txt
docker stats rebash-log-18130 --no-stream --format 'table {{ "{{" }}.Name{{ "}}" }}\t{{ "{{" }}.CPUPerc{{ "}}" }}\t{{ "{{" }}.MemUsage{{ "}}" }}' | tee stats-snapshot.txt
test -s stats-snapshot.txt
Expected output
container-logs.txt shows startup and health log lines; stats-snapshot.txt lists CPU and memory for the container.
Task 3 – Prove health status via inspect
Wait for the health probe to report healthy:
cd ~/rebash-docker/module-13
docker inspect rebash-log-18130 --format 'Health={{ "{{" }}.State.Health.Status{{ "}}" }} Status={{ "{{" }}.State.Status{{ "}}" }}' | tee health-inspect.txt
grep -E 'Health=healthy|Health=starting' health-inspect.txt
Expected output
health-inspect.txt shows Health=healthy (or starting if probes have not finished — wait and re-run).
Validation steps
- Dockerfile defines
HEALTHCHECKagainst/healthz -
docker logsshows structured startup and health lines -
docker stats --no-streamproduces a snapshot - Inspect reports health status
- Cleanup removes container and image
Common errors and fixes
| Error | Cause | Fix |
|---|---|---|
Health stays starting | Probe interval not elapsed | Wait 30s; check docker inspect Log array |
| Empty logs | App logs to stderr only | Use stdout (as in app.py) or docker logs without redirect filter |
connection refused on curl | Container not ready | docker ps; check docker logs for Python errors |
| Stats shows 0B memory | Race on brand-new container | Re-run stats after a few seconds |
Challenge exercise
Add a Compose file with logging driver options (max-size, max-file) and prove rotation settings via docker inspect on the container LogConfig.
Learning outcomes
- Embedded a Dockerfile health check aligned with the app endpoint
- Collected operational logs from a running container
- Captured point-in-time CPU/memory with
docker stats - Verified health state through inspect, not guesswork
Cleanup
docker rm -f rebash-log-18130 2>/dev/null || true
docker rmi rebash-log-lab:1.0.0 2>/dev/null || true
rm -f ~/rebash-docker/module-13/*.txt
Validation
- Lab commands run under
~/rebash-docker/module-13/ - You can explain each Theory section in your own words
- You used modern tooling where it applies to this topic
- You can describe one production failure mode for this topic
Code Walkthrough
Production practice for Container Logging and Monitoring always combines:
- Inspect before you change (status, plan, logs, dry-run)
- Prefer reversible, documented changes (Git, IaC, drop-ins, version pins)
- Capture evidence (command output, pipeline logs) for handovers
- Prefer current tools and APIs over legacy shortcuts
- Least privilege — escalate credentials only when required
Keep runbooks short enough to follow under pressure. Automate checks; keep humans for judgement.
Security Considerations
- Treat credentials and tokens for docker as privileged — never commit them
- Prefer short-lived auth (OIDC, roles, SSO) over long-lived keys
- Validate blast radius before apply/deploy/delete operations
- Restrict who can approve production changes
- Collect audit logs; limit who can read sensitive traces
Common Mistakes
Writing logs only inside the container filesystem
Validate assumptions against the Theory section and official docs before changing production.
Healthchecks that always succeed (testing the shell, not the app)
Lab shortcuts (open security groups, admin roles, skip approvals) must not ship unchanged.
Changing production without a rollback path
Always know how to revert (previous artefact, prior release, state rollback, DNS failback).
Best Practices
- Encode Container Logging and Monitoring changes as code and review them in pull requests
- Pin versions (images, modules, actions, provider plugins)
- Separate environments with clear promotion gates
- Alert on symptoms with runbooks attached
- Destroy lab resources; tag everything with owner and expiry where possible
Troubleshooting
| Symptom | Likely cause | Fix |
|---|---|---|
| Auth / permission denied | Wrong identity, policy, or scope | Check caller identity, roles, and least-privilege policies |
| Timeout / no route | Network, DNS, security group, or endpoint | Trace path, DNS, and allow-lists before retrying |
| Drift / unexpected plan | Manual change or wrong state/workspace | Reconcile desired vs actual; avoid click-ops on managed resources |
| Pipeline/job red | Flaky step, cache, or missing secret | Read failing step logs; bisect recent workflow/config changes |
| Cost spike | Idle load balancer, NAT, oversized compute | Inventory billable resources; stop/delete labs promptly |
Summary
Container Logging and Monitoring is essential for Cloud and DevOps engineers working with docker. Practise the lab until the inspection and change path is muscle memory, then continue the track.
Interview Questions
- Default Docker logging driver behaviour?
- How do you avoid disk fill from container logs?
- What should app logs include for operations?
- Logs disappear after container rm — implications?
- How does this change on Kubernetes?
Sample answer — question 2
Check logging driver in inspect, docker logs, and host disk usage.
Sample answer — question 4
Do not log secrets. Centralise logs with retention/access controls.