Monitoring and Observability on AWS
Overview
You cannot fix what you cannot see. When a website is “slow” or “down”, engineers look at metrics (numbers over time), logs (line-by-line events), and traces (request paths across services).
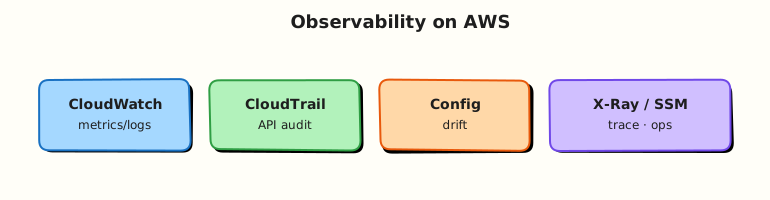
On AWS, Amazon CloudWatch is the default home for metrics and logs. CloudWatch alarms turn metrics into actions — for example “email me when queue depth > 10”. Amazon SNS (Simple Notification Service) delivers those alerts.
This module teaches observability vocabulary first, then a lab where you publish a custom metric, drive an alarm to ALARM, then back to OK — with saved CLI evidence.
This is Tutorial 1 in Module 9: Monitoring & Observability of the REBASH Academy AWS for Cloud & DevOps Engineers series.
Cost hygiene
Custom metrics and alarms are inexpensive at lab scale. SNS email is free; SMS costs extra — skip SMS in labs. Delete alarms and topics in Cleanup.
Prerequisites
- Serverless on AWS — you have seen CloudWatch Logs from Lambda
- AWS CLI v2 with
cloudwatch:*,sns:* - Optional: email inbox if you subscribe SNS (not required to prove alarm states)
Learning Objectives
By the end of this tutorial, you will be able to:
- Explain metrics vs logs vs traces with everyday analogies
- Publish custom metrics with
cloudwatch put-metric-data - Create CloudWatch alarms wired to SNS
- Prove alarm state transitions ALARM → OK with CLI evidence
- Describe OK, ALARM, and INSUFFICIENT_DATA states
- Answer fresher interview questions on alert fatigue and billing alarms
Architecture
Applications and AWS services emit metrics to CloudWatch. Logs flow to log groups. Alarms evaluate metrics over time periods and invoke SNS topics or Auto Scaling policies. Operators use dashboards; on-call receives SNS notifications.
Theory
The problem (before AWS words)
Users report “the app feels broken.” Is it CPU, errors, or a downstream API? Without signals, engineers guess. Observability means having data to ask questions you did not know to ask in advance.
Metrics — the dashboard numbers
Problem: You need to know how much and how often — CPU 85%, error rate 2%, queue depth 50.
Analogy: Metrics are like a car dashboard — speedometer and fuel gauge, not a diary of every turn.
AWS name: CloudWatch Metrics — time series with namespace, name, and optional dimensions.
Tiny example: Publish QueueDepth = 25 to namespace Rebash/Module09.
Interview one-liner: “Metrics aggregate numbers for dashboards and thresholds; logs give forensic detail.”
Logs — the diary
Problem: Metrics show that errors spiked; logs show why (stack trace, request ID).
Analogy: CloudWatch Logs is a searchable diary — Lambda writes to /aws/lambda/function-name automatically.
Interview one-liner: “Page on metrics; diagnose with logs (and traces for latency across services).”
Traces — the request journey
Problem: Microservices make it hard to see where 800 ms was spent.
Analogy: AWS X-Ray (and OpenTelemetry) is a GPS track of one request through many services.
Logs and traces matter too; this lab focuses on metrics and alarms first.
CloudWatch alarms — if-this-then-pager
Problem: Nobody watches dashboards 24/7.
Analogy: An alarm is a smoke detector on a metric — if average queue depth > 10 for two minutes, buzz the on-call phone (via SNS).
AWS name: CloudWatch Alarm.
States you must know:
| State | Plain meaning |
|---|---|
| OK | Metric within threshold |
| ALARM | Breach condition met for enough periods |
| INSUFFICIENT_DATA | Not enough datapoints to decide |
Interview one-liner: “TreatMissingData controls whether missing points count as breaching — wrong setting causes false pages or silence.”
SNS — alert delivery
Problem: CloudWatch should not hard-code “send email to Bob.”
Analogy: SNS is a megaphone — one alarm publishes to a topic; email, Lambda, or chat bots subscribe.
Tiny example: Alarm action → SNS topic → email subscriber.
Golden signals (awareness)
Site Reliability Engineering (SRE) teams often watch:
- Latency — how slow
- Traffic — how much
- Errors — how many failures
- Saturation — how full (CPU, disk, queue)
Common pitfalls
- Paging on CPU alone without error/latency context
- No OK action — team never knows recovery happened
- Ignoring INSUFFICIENT_DATA — alarm never fires
- Verbose DEBUG logs on high-traffic services — big bills
- Forgetting billing metrics live in us-east-1
Hands-on Lab
Objective
Create an SNS topic, publish a custom metric, configure a CloudWatch alarm, prove ALARM then OK transitions, and clean up all resources.
Prerequisites
| Tool | Notes |
|---|---|
| AWS CLI v2 | put-metric-data, put-metric-alarm |
| jq | Parse alarm state |
Lab environment
mkdir -p ~/rebash-aws/module-09 && cd ~/rebash-aws/module-09
export AWS_REGION="${AWS_REGION:-eu-west-2}"
export AWS_PAGER=""
export NS="Rebash/Module09"
export METRIC="QueueDepth"
export ALARM="rebash-m09-queue-depth"
export TOPIC="rebash-m09-alerts"
echo "$NS" | tee namespace.txt
aws sts get-caller-identity --output table
Real-world scenario
An SRE ticket asks for alerting when queue depth exceeds 10 for two consecutive minutes. You stand up SNS routing, push synthetic metric datapoints to breach and clear the threshold, and capture alarm history JSON as evidence — the same proof required before enabling Auto Scaling policies.
Step-by-step tasks
Task 1 – Create SNS topic
cd ~/rebash-aws/module-09
TOPIC=rebash-m09-alerts
aws sns create-topic --name "$TOPIC" --output json | tee create-topic.json
TOPIC_ARN=$(jq -r '.TopicArn' create-topic.json)
echo "$TOPIC_ARN" | tee topic-arn.txt
test -n "$TOPIC_ARN"
Expected output
topic-arn.txt contains arn:aws:sns:…:rebash-m09-alerts.
Task 2 – Create alarm on custom metric
Create alarm-actions.json:
{
  "AlarmName": "rebash-m09-queue-depth",
  "Namespace": "Rebash/Module09",
  "MetricName": "QueueDepth",
  "Statistic": "Average",
  "Period": 60,
  "EvaluationPeriods": 2,
  "Threshold": 10,
  "ComparisonOperator": "GreaterThanThreshold",
  "TreatMissingData": "notBreaching",
  "AlarmActions": ["TOPIC_ARN_PLACEHOLDER"],
  "OKActions": ["TOPIC_ARN_PLACEHOLDER"]
}
cd ~/rebash-aws/module-09
TOPIC_ARN=$(cat topic-arn.txt)
sed "s|TOPIC_ARN_PLACEHOLDER|${TOPIC_ARN}|g" alarm-actions.json > alarm.json
aws cloudwatch put-metric-alarm --cli-input-json file://alarm.json
aws cloudwatch describe-alarms --alarm-names rebash-m09-queue-depth \
  --output json | tee alarm-initial.json
jq -r '.MetricAlarms[0].StateValue' alarm-initial.json | tee state-initial.txt
Expected output
Alarm created; initial state INSUFFICIENT_DATA or OK.
Task 3 – Publish high metric values → ALARM
cd ~/rebash-aws/module-09
NS=$(cat namespace.txt)
for i in 1 2 3; do
  aws cloudwatch put-metric-data --namespace "$NS" --metric-data \
    MetricName=QueueDepth,Value=25,Unit=Count
  sleep 5
done
echo "waiting for alarm evaluation (up to 3 minutes)..."
for i in $(seq 1 36); do
  STATE=$(aws cloudwatch describe-alarms --alarm-names rebash-m09-queue-depth \
    --query 'MetricAlarms[0].StateValue' --output text)
  echo "state=$STATE"
  echo "$STATE" | tee -a state-log.txt
  [[ "$STATE" == "ALARM" ]] && break
  sleep 5
done
grep -q ALARM state-log.txt
aws cloudwatch describe-alarm-history --alarm-name rebash-m09-queue-depth \
  --history-item-type StateUpdate --max-records 5 --output json | tee history-alarm.json
Expected output
state-log.txt contains ALARM; history shows transition to ALARM.
Task 4 – Publish low values → OK and cleanup
cd ~/rebash-aws/module-09
NS=$(cat namespace.txt)
for i in 1 2 3; do
  aws cloudwatch put-metric-data --namespace "$NS" --metric-data \
    MetricName=QueueDepth,Value=1,Unit=Count
  sleep 5
done
echo "waiting for OK state..."
for i in $(seq 1 36); do
  STATE=$(aws cloudwatch describe-alarms --alarm-names rebash-m09-queue-depth \
    --query 'MetricAlarms[0].StateValue' --output text)
  echo "state=$STATE"
  echo "$STATE" | tee -a state-log-ok.txt
  [[ "$STATE" == "OK" ]] && break
  sleep 5
done
grep -q OK state-log-ok.txt
echo "alarm transition OK" | tee evidence.txt
aws cloudwatch delete-alarms --alarm-names rebash-m09-queue-depth
TOPIC_ARN=$(cat topic-arn.txt)
aws sns delete-topic --topic-arn "$TOPIC_ARN"
echo "cleanup OK" | tee cleanup-ok.txt
Expected output
States progress ALARM → OK; alarm and SNS topic deleted.
Validation steps
- SNS topic created with ARN captured
- Alarm on custom namespace
Rebash/Module09created - High metric values triggered ALARM state
- Low metric values returned alarm to OK
- Alarm and topic deleted
Common errors and fixes
| Error | Cause | Fix |
|---|---|---|
| Alarm stuck INSUFFICIENT_DATA | Not enough periods | Publish more datapoints; wait 2× period |
| AccessDenied on SNS | IAM | Add sns:CreateTopic/Publish |
| No state change | Wrong namespace/name | Match PutMetricData to alarm fields |
| Email not received | Unconfirmed subscription | Lab proves CLI state; confirm email separately |
Challenge exercise
Create billing-alarm-steps.sh that echoes the CLI steps for a billing alarm on AWS/Billing EstimatedCharges > $10 in us-east-1 (do not run unless you intend to alert your real account).
#!/bin/bash
set -euo pipefail
echo "Billing metrics publish in us-east-1 only"
echo "Namespace: AWS/Billing"
echo "Metric: EstimatedCharges"
echo "Enable Billing Alerts in console Billing preferences first"
echo "Example: aws cloudwatch put-metric-alarm --region us-east-1 --alarm-name student-billing ..."
cd ~/rebash-aws/module-09
chmod +x billing-alarm-steps.sh
./billing-alarm-steps.sh | tee billing-alarm-output.txt
grep -qi billing billing-alarm-output.txt
grep -qi EstimatedCharges billing-alarm-output.txt
echo "billing challenge OK" | tee challenge.txt
Learning outcomes
- You published custom metrics and drove alarm state transitions
- You wired SNS as an alarm action target
- You captured alarm history as operational evidence
- You can contrast metrics vs logs vs traces in incidents
Cleanup
cd ~/rebash-aws/module-09
aws cloudwatch delete-alarms --alarm-names rebash-m09-queue-depth 2>/dev/null || true
TOPIC_ARN=$(cat topic-arn.txt 2>/dev/null || echo "")
if [[ -n "$TOPIC_ARN" ]]; then aws sns delete-topic --topic-arn "$TOPIC_ARN" 2>/dev/null || true; fi
rm -f state-log.txt state-log-ok.txt evidence.txt
Validation
- Lab evidence under
~/rebash-aws/module-09 - You can explain OK/ALARM/INSUFFICIENT_DATA without notes
- You know billing alarms use us-east-1
- No rebash-m09 alarms or topics remain
Code Walkthrough
- Custom namespace —
Rebash/Module09avoids collision with AWS service namespaces. - EvaluationPeriods × Period — two 60 s periods ≈ up to 2 minutes to ALARM.
- TreatMissingData —
notBreachingavoids false pages before first datapoint in some designs. - Alarm history JSON — attach to incident tickets as proof of transition time.
- Delete alarm before topic — stops stray notifications during teardown.
Security Considerations
- Restrict SNS publish/subscribe with IAM policies.
- Encrypt SNS topics with KMS for sensitive alert content.
- Do not put secrets in alarm descriptions or log metric filters.
- Separate topics for security vs operational alerts.
- Audit alarm changes via CloudTrail.
Common Mistakes
Paging on CPU alone
CPU without latency/error context causes false positives. Pair with golden signals.
Missing OK notifications
On-call assumes issue persists. Wire OKActions to the same routing tier.
Unbounded log retention
CloudWatch Logs ingest bills forever. Set retention (7–30 days in non-prod).
Best Practices
- Dashboards per service with SLI metrics (availability, latency, errors)
- Link runbooks in alarm descriptions
- Use composite alarms to reduce fan-out
- Logs Insights saved queries for common failures
- OpenTelemetry + ADOT for portable instrumentation
Troubleshooting
| Symptom | Likely cause | Fix |
|---|---|---|
| Alarm never ALARMs | Threshold/statistic wrong | Graph metric; verify Average vs Sum |
| INSUFFICIENT_DATA forever | No datapoints / wrong Region | Confirm Region; publish metrics |
| SNS not delivered | No subscription / KMS | Add confirmed subscriber; check key policy |
| Metric delay | Aggregation delay | Wait full evaluation windows |
Summary
CloudWatch metrics and alarms plus SNS routing form the core AWS alerting path. Proving ALARM → OK with custom metrics is interview-grade evidence that you understand evaluation periods — not just that you can click in the console.
Next: AWS Security Services.
Interview Questions
1. Metrics vs logs vs traces — simple difference?
Reveal answer
Metrics are aggregated numbers over time (CPU, error rate) — good for dashboards and alarms. Logs are individual event lines (stack traces, request IDs) — good for diagnosis. Traces follow one request across services — good for finding latency bottlenecks. Page on metrics; debug with logs and traces.
2. What are CloudWatch alarm states?
Reveal answer
OK — metric within threshold. ALARM — breach condition met for configured evaluation periods. INSUFFICIENT_DATA — not enough datapoints to judge. TreatMissingData defines behaviour when points are missing.
3. Why publish custom metrics?
Reveal answer
Built-in AWS metrics may not expose business signals (queue depth, orders per minute, failed logins). Applications emit custom metrics with PutMetricData so alarms and Auto Scaling can react to what customers actually care about.
4. What does SNS do in alerting?
Reveal answer
SNS decouples alarm firing from delivery — one CloudWatch alarm action publishes to an SNS topic; email, SMS, Lambda (ChatOps), SQS, or HTTP endpoints subscribe. You can fan out to multiple on-call paths.
5. How do you reduce alert fatigue?
Reveal answer
Page only on customer-impacting signals, use composite alarms, require multiple evaluation periods, separate severity topics, send OK notifications when recovered, and review alarm inventory regularly in ops meetings.
6. Where do billing alarms live?
Reveal answer
Billing metrics publish to namespace AWS/Billing, metric EstimatedCharges, in us-east-1 — even if your workloads run elsewhere. Enable billing alerts in account preferences; combine with AWS Budgets for forecasts.
7. What is TreatMissingData?
Reveal answer
It defines alarm behaviour when datapoints are missing: missing (default), ignore, breaching, or notBreaching. Wrong settings cause false alarms or silent failures — especially for sparse custom metrics.
8. What Lambda metrics matter most?
Reveal answer
CloudWatch provides Invocations, Errors, Duration, Throttles, and ConcurrentExecutions. Alarm on error rate and duration; use logs in /aws/lambda/<name> for stack traces.