Monitoring and Observability on Google Cloud
Overview
You cannot fix what you cannot see. When a service is “slow” or “down”, engineers look at metrics (numbers over time), logs (events), and traces (request paths).
On Google Cloud, Cloud Logging stores logs, Cloud Monitoring stores metrics and alerts, and Cloud Trace / Profiler / Error Reporting deepen application visibility. Managed Service for Prometheus appears in Kubernetes-heavy shops.
This is Tutorial 1 in Module 10: Monitoring & Observability of the REBASH Academy Google Cloud for Cloud & DevOps Engineers series. You will write and query a log, create a log-based metric and alert policy (with a console/CLI-friendly path), prove the pieces exist, and clean up.
Cost hygiene
Logs and metrics have free tiers and retention costs. Do not set 1-second scrapes on huge cardinalities. Delete lab alert policies and uptime checks in Cleanup.
Prerequisites
- Data and Analytics on Google Cloud
- Permission to write logs and create Monitoring alert policies (Owner sandbox is fine)
Learning Objectives
By the end of this tutorial, you will be able to:
- Explain logs vs metrics vs traces in plain English
- Write a log entry and query it with
gcloud logging read - Create a log-based metric and an alert policy (or documented fallback)
- Describe uptime checks and Managed Prometheus at interview depth
- Delete lab monitoring resources
Architecture
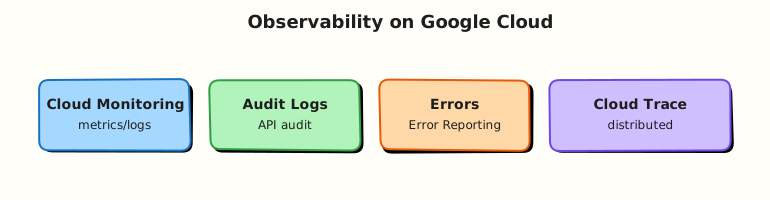
Applications and Google services emit logs to Cloud Logging and metrics to Cloud Monitoring. Alert policies evaluate metrics (including log-based metrics) and notify via channels. Uptime checks probe URLs from Google’s probes.
Theory
What it is
Observability is the ability to understand system state from external outputs. Google Cloud’s operations suite (formerly Stackdriver) is the default toolkit: Logging, Monitoring, Error Reporting, Trace, Profiler.
Why it matters
On-call without logs/metrics is guessing. Interviews expect: golden signals (latency, traffic, errors, saturation), alert fatigue awareness, and “what do you page on vs dashboard?”.
How it works
- Resources emit logs/metrics automatically; apps can add custom ones.
- You query logs with filters.
- Log-based metrics turn filter matches into time series.
- Alert policies threshold those series and notify.
- Uptime checks add synthetic probes from outside the VM.
Signals
| Signal | Example |
|---|---|
| Metrics | CPU, request count, custom rebash/heartbeat |
| Logs | textPayload / structured JSON errors |
| Traces | Span waterfall across Cloud Run services |
| Profiles | CPU hotspots in production binaries |
Common pitfalls
- Alerting on noisy metrics → pages nobody trusts
- No log labels → cannot filter by
tutorial=rebash-m10 - Infinite log retention “just in case”
- Forgetting to delete uptime checks hitting deleted Cloud Run URLs
Hands-on Lab
Objective
Write a labelled log entry, query it back, create a log-based counter metric for that entry, attach a simple alert policy (or fallback evidence), then delete lab monitoring objects.
Prerequisites
| Tool | Notes |
|---|---|
| Monitoring / Logging APIs | Enabled in lab |
| Optional notification channel | Email channel in Console if you want a real page |
Lab environment
mkdir -p ~/rebash-gcp/module-10 && cd ~/rebash-gcp/module-10
export PROJECT_ID="${PROJECT_ID:-$(gcloud config get-value project)}"
export REGION="${REGION:-europe-west2}"
gcloud config set project "$PROJECT_ID"
gcloud services enable logging.googleapis.com monitoring.googleapis.com --project="$PROJECT_ID"
Real-world scenario
Before a service ships, platform asks for: a log line you can find under pressure, a metric derived from that log, and an alert policy stub that would page if the metric spiked. Prove the wiring with CLI evidence.
Step-by-step tasks
Task 1 – Write and query a log
cd ~/rebash-gcp/module-10
gcloud logging write rebash-m10 \
  "rebash-m10 ok" \
  --severity=DEFAULT \
  --format=json | tee write-log.json
# Allow ingestion a few seconds
sleep 5
gcloud logging read \
  'logName="projects/'"${PROJECT_ID}"'/logs/rebash-m10" AND textPayload:"rebash-m10 ok"' \
  --limit=5 --format=json | tee log-read.json
test -s log-read.json
grep -q "rebash-m10 ok" log-read.json
Expected output
log-read.json includes your payload. If empty, wait 15s and re-run the read (ingestion delay).
Task 2 – Log-based metric
cd ~/rebash-gcp/module-10
gcloud logging metrics delete rebash_m10_ok --quiet 2>/dev/null || true
gcloud logging metrics create rebash_m10_ok \
  --description="Count of rebash-m10 ok log lines" \
  --log-filter='logName="projects/'"${PROJECT_ID}"'/logs/rebash-m10" AND textPayload:"rebash-m10 ok"' \
  --format=json | tee metric-create.json
gcloud logging metrics describe rebash_m10_ok --format=json | tee metric.json
grep -q rebash_m10_ok metric.json
# Generate a few more points
for i in 1 2 3; do gcloud logging write rebash-m10 "rebash-m10 ok"; done
Task 3 – Alert policy (CLI or Console fallback)
Create alert-policy.json in your editor:
{
  "displayName": "rebash-m10-ok-spike",
  "combiner": "OR",
  "conditions": [
    {
      "displayName": "rebash_m10_ok above 0",
      "conditionThreshold": {
        "filter": "metric.type=\"logging.googleapis.com/user/rebash_m10_ok\" AND resource.type=\"global\"",
        "comparison": "COMPARISON_GT",
        "thresholdValue": 0,
        "duration": "60s",
        "trigger": { "count": 1 },
        "aggregations": [
          {
            "alignmentPeriod": "60s",
            "perSeriesAligner": "ALIGN_DELTA"
          }
        ]
      }
    }
  ],
  "enabled": true
}
cd ~/rebash-gcp/module-10
set +e
gcloud alpha monitoring policies create --policy-from-file=alert-policy.json \
  --format=json 2>&1 | tee alert-create.txt
AC_RC=$?
set -e
if [[ "$AC_RC" -ne 0 ]]; then
  # Fallback: create via Monitoring API-friendly beta or document Console
  printf '%s\n' '{"fallback":"create alert in Console → Alerting → Create policy on metric logging.googleapis.com/user/rebash_m10_ok"}' \
    | tee alert-create.txt
  gcloud monitoring policies list --format="table(displayName,name)" 2>/dev/null \
    | tee policies.txt || true
fi
# Uptime check optional prove (HTTP against example.com — delete later)
gcloud monitoring uptime create rebash-m10-uptime \
  --resource-type=uptime-url \
  --host=example.com \
  --path=/ \
  --format=json 2>&1 | tee uptime.json || \
  printf '%s\n' '{"fallback":"uptime-create-skipped"}' | tee uptime.json
echo "monitoring proof OK" | tee evidence.txt
Notification channels
Without an email/SMS channel, the policy still proves metric→condition wiring. Add a channel in Console for a real notification test.
Validation steps
- Log write/read evidence exists
- Log-based metric
rebash_m10_okdescribed - Alert policy created or fallback documented; uptime file present
Common errors and fixes
| Error you see | Plain meaning | What to do |
|---|---|---|
| Empty log read | Ingestion delay / wrong filter | Wait; broaden filter; check project |
| Metric create already exists | Leftover lab | gcloud logging metrics delete rebash_m10_ok |
| Alert filter invalid | Metric not visible yet | Wait for points; fix resource.type |
| Alpha/beta command missing | SDK components | Use Console fallback; install alpha |
Challenge exercise
Write golden-signals.txt listing latency, traffic, errors, saturation with one Google Cloud metric/log idea each for Cloud Run.
cd ~/rebash-gcp/module-10
test -s golden-signals.txt
wc -l golden-signals.txt | tee challenge.txt
Learning outcomes
- You proved log round-trip with CLI filters
- You created a log-based metric — the bridge to alerting
- You can explain uptime checks vs app metrics
Cleanup
cd ~/rebash-gcp/module-10
export PROJECT_ID="${PROJECT_ID:-$(gcloud config get-value project)}"
# Delete policies named rebash-m10
POLICIES=$(gcloud monitoring policies list --filter='displayName:rebash-m10' --format='value(name)' 2>/dev/null || true)
for p in $POLICIES; do gcloud monitoring policies delete "$p" --quiet 2>/dev/null || true; done
gcloud monitoring uptime list --format='value(name)' 2>/dev/null | while read -r u; do
  case "$u" in *rebash-m10*) gcloud monitoring uptime delete "$u" --quiet 2>/dev/null || true ;; esac
done
gcloud logging metrics delete rebash_m10_ok --quiet 2>/dev/null || true
rm -f write-log.json log-read.json metric-create.json metric.json \
  alert-create.txt alert-policy.json policies.txt uptime.json evidence.txt challenge.txt
Validation
- Lab folder
~/rebash-gcp/module-10used - Lab metric/policy/uptime removed
- You can teach logs vs metrics without notes
Code Walkthrough
- Write then read — proves the project’s logging path.
- Log-based metric — turns a needle in logs into an alertable series.
- Alert policy JSON — infrastructure-as-code mindset for Monitoring.
- Uptime check — synthetic outside view (optional if API differs).
- Cleanup policies first — stop noise before deleting metrics.
Security Considerations
- Logs may contain secrets — redact at source; restrict log bucket IAM.
- Alert channels are sensitive (email lists, webhooks).
- Do not grant
logging.adminto app runtimes.
Common Mistakes
More alerts = better reliability
Untrusted pages get ignored. Page on symptoms users feel; dashboard the rest.
Metrics replace logs
You need both. Metrics for trends/pages; logs for why.
Default retention is forever
It is not. Plan sinks and retention for compliance and cost.
Best Practices
- Structured JSON logs with request IDs
- SLOs before a sea of thresholds
- Label resources consistently
- Separate user-facing pages from ticket queues
- Trace sampling that you can afford
Troubleshooting
| Symptom | Likely cause | Fix |
|---|---|---|
| Metric has no data | Filter mismatch | Align logName/text with write |
| Policy never fires | Alignment/duration | Loosen duration; confirm metric points |
| Uptime failing | Host/path wrong | Fix URL; remember to delete |
Summary
Cloud Logging and Cloud Monitoring are the default observability pair on Google Cloud. Log-based metrics connect “I see a line” to “page me when it spikes”. Next: security services — Secret Manager and related controls.
Interview Questions
1. Logs vs metrics vs traces?
Reveal answer
Logs are event records. Metrics are numeric time series. Traces show a request’s path across services. Together they support diagnosis and alerting.
2. What is a log-based metric?
Reveal answer
A Cloud Monitoring metric derived from a Cloud Logging filter, so matching log lines become countable/chartable time series you can alert on.
3. What are the four golden signals?
Reveal answer
Latency, traffic, errors, and saturation — a classic SRE starting set for service health.
4. What does an uptime check do?
Reveal answer
It periodically probes a URL or resource from Google-managed probers to detect availability failures independent of your in-process metrics.
5. Why is alert fatigue dangerous?
Reveal answer
Too many low-value pages train humans to ignore alerts, including real incidents. Prefer fewer, higher-quality symptom-based pages.
6. Where do Cloud Run request logs show up?
Reveal answer
In Cloud Logging under the Cloud Run service’s log names; you filter by resource labels such as service name and revision.
7. What is Managed Service for Prometheus?
Reveal answer
A Google-managed Prometheus-compatible metrics backend commonly used with GKE, so you can keep PromQL workflows without running your own Prometheus HA stack.
8. How do you prove logging works in a new project?
Reveal answer
Write a known log line with gcloud logging write, query it back with gcloud logging read, and save the JSON evidence — as in Task 1.
Related Tutorials
- Previous: Data and Analytics on Google Cloud
- Next: Google Cloud Security Services
- Parallel: Monitoring on AWS