Host Monitoring — vmstat, iostat, and sar
Overview
When someone says “the server feels slow”, you need numbers — not guesses. Cloud dashboards help, but host tools such as vmstat, iostat, and sar still matter when agents fail or you are on SSH only.
Plain problem: CPU at 100%, disk light blinking constantly, or swap churning — three different stories. vmstat, iostat, and sar (from the sysstat package) give quick host-level signals for CPU, memory, swap, and disk Input/Output (I/O).
This is Tutorial 12b in Module 12: Logging & Monitoring of the REBASH Academy Linux for Cloud & DevOps Engineers series.
Prerequisites
- Ubuntu practice VM with
sudo - Basic comfort with
toporhtop(helpful but not required) - Completed logging tutorial (you know where to save evidence)
Learning Objectives
By the end of this tutorial, you will be able to:
- Explain what vmstat, iostat, and sar measure in plain language
- Install sysstat and capture baseline samples
- Generate controlled load and compare before/after metrics
- Read CPU idle, swap activity, and disk utilisation columns
- Relate CLI signals to “slow server” interview stories
- Answer fresher interview questions on host monitoring
Architecture
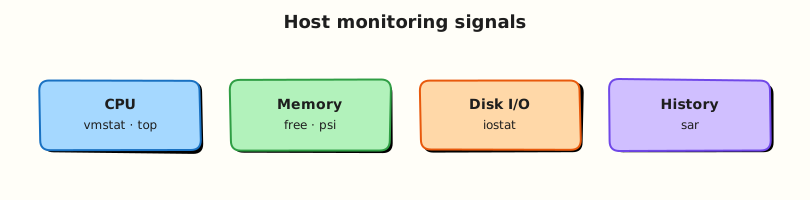
The kernel tracks CPU scheduling, memory pages, swap, and block I/O. sysstat tools read /proc and kernel counters and print human-readable tables. sar can store history when the sysstat collector is enabled.
Theory
The problem (before any jargon)
Ticket: “API latency high.” You restart the app. Still slow. Later someone notices disk utilisation at 100% — the database on the same disk was the bottleneck, not the API process. Monitoring narrows which resource is saturated.
vmstat — virtual memory statistics
Analogy: vmstat is a five-second health snapshot of the whole host — processes waiting, memory pressure, swap in/out, CPU idle.
Columns to watch first:
| Column | Plain meaning |
|---|---|
r | Runnable processes (CPU queue) |
si / so | Swap in / swap out (memory pressure) |
us / sy / id | User / system / idle CPU |
wa | CPU waiting on I/O |
Interview line: “High wa suggests I/O wait; high si/so suggests memory pressure and swap.”
iostat — disk I/O
Analogy: iostat zooms into each disk — reads/writes per second and %util (how busy the device is).
%util near 100% on a disk serving your database is a smoking gun.
sar — history and trends
Analogy: sar is yesterday’s notebook if sysstat collection is enabled — CPU, memory, I/O over time.
On Ubuntu, enable ongoing collection by setting ENABLED="true" in /etc/default/sysstat if your policy allows.
When CLI beats the dashboard
- Jump box with no agent during an outage
- Interview whiteboard: “How would you prove disk-bound?”
- Validating that a cloud graph matches ground truth
Pair CLI checks with Prometheus node exporter, CloudWatch, Datadog, etc. in production.
Common pitfalls
- Staring at CPU only while disk is saturated
- Ignoring swap (
si/so) until OOM kills appear - One sample only — transients mislead; take 5–10 seconds
- Confusing load average with CPU % (load includes waiting tasks)
Hands-on Lab
Objective
Install sysstat, capture baseline vmstat/iostat/sar, generate controlled CPU and disk load, compare metrics, and save proof under ~/rebash-linux/lab19.
Prerequisites
| Item | Notes |
|---|---|
| Ubuntu VM | 1+ CPU, a few GB RAM |
sudo | For sysstat install and enabling collector |
stress-ng optional | Or use built-in dd for disk load |
Lab environment
mkdir -p ~/rebash-linux/lab19 && cd ~/rebash-linux/lab19
sudo apt update && sudo apt install -y sysstat
Real-world scenario
Mentor: “Users report slowness at 14:00. Show me baseline vmstat/iostat, then reproduce mild CPU and disk pressure in the lab and point at which columns changed.”
Step-by-step tasks
Task 1 – Baseline samples
cd ~/rebash-linux/lab19
vmstat 1 5 | tee vmstat-baseline.txt
iostat -xz 1 3 | tee iostat-baseline.txt
sar -u 1 3 | tee sar-cpu-baseline.txt
test -s vmstat-baseline.txt
grep -E ' id ' vmstat-baseline.txt | tail -3 | tee idle-sample.txt
Expected output
idle-sample.txt shows CPU idle (id) typically high on an idle lab VM.
Task 2 – Controlled CPU load and re-measure
cd ~/rebash-linux/lab19
( yes >/dev/null ) & pid=$!
sleep 2
vmstat 1 5 | tee vmstat-under-cpu-load.txt
kill "$pid" 2>/dev/null || true
wait "$pid" 2>/dev/null || true
grep -E ' [0-9]+ [0-9]+ [0-9]+ [0-9]+ [0-9]+ [0-9]+ [0-9]+ [0-9]+ [0-9]+ [0-9]+ [0-9]+ [0-9]+ [0-9]+ [0-9]+ [0-9]+ ' vmstat-under-cpu-load.txt | tail -3 | tee cpu-load-idle.txt
Expected output
Under yes load, idle (id) drops compared to baseline — CPU is busy.
Task 3 – Disk load, break interpretation, fix understanding
cd ~/rebash-linux/lab19
dd if=/dev/zero of=/tmp/lab19-diskload bs=1M count=256 oflag=direct 2>&1 | tee dd-write.txt &
sleep 1
iostat -xz 1 5 | tee iostat-under-disk-load.txt
wait
iostat -xz 1 3 | tee iostat-after-disk-load.txt
echo "mistake: only checked CPU during disk incident" > misread-notes.txt
echo "fix: check iostat %util and vmstat wa column" >> misread-notes.txt
cat misread-notes.txt | tee break-fix-notes.txt
echo "lab19 monitoring OK" | tee evidence.txt
Expected output
During dd, iostat shows higher %util on the disk device; break-fix-notes.txt documents the CPU-vs-disk diagnostic mistake.
Validation steps
- sysstat installed; baseline and under-load files saved
- CPU load lowered idle column visibly
- Disk load raised I/O utilisation during
dd - You can explain one column from vmstat and iostat
Common errors and fixes
| Error | Cause | Fix |
|---|---|---|
vmstat: command not found | sysstat not installed | sudo apt install sysstat |
| sar shows no history | Collector disabled | /etc/default/sysstat ENABLED=true |
| All zeros in iostat | Wrong interval / no activity | Run during dd or app load |
| Misread load average | Includes I/O wait tasks | Cross-check vmstat wa, iostat |
Challenge exercise
Enable sysstat history (if policy allows), reboot not required — set ENABLED="true" and sudo systemctl enable --now sysstat, then run sar -u after a few minutes.
Learning outcomes
- You captured real vmstat/iostat/sar samples
- You linked load types to metric columns
- You documented a common diagnostic misread (CPU-only tunnel vision)
Cleanup
Validation
- Evidence under
~/rebash-linux/lab19 - Can narrate “slow server” triage in three tools
- Ready for SSH hardening next
Code Walkthrough
vmstat 1 5— 1-second interval, 5 samples; good incident habit.iostat -xz 1 3— extended, skip zero devices, human sizes.sar -u— CPU breakdown when sysstat history exists.- Background
yes— cheap CPU burner for lab only. dd … oflag=direct— bypasses cache somewhat — shows disk pressure in lab.
Security Considerations
- Do not run destructive stress tools on shared production hosts without approval.
- Monitoring data can reveal workload patterns — protect sar archives.
- High load tests in cloud may trigger alerts — use sandbox accounts.
- Read-only monitoring commands are safe; load generation is not.
Common Mistakes
❌ CPU tunnel vision.
✅ Check disk (iostat) and memory/swap (vmstat) before scaling CPU.
❌ Single snapshot.
✅ Take several intervals; spikes and sustained saturation tell different stories.
❌ Ignoring swap.
✅ Rising si/so means RAM pressure — fix memory or swap config before buying CPUs.